Maps and Density Heatmaps
Count Data
There are a total of 9191 incidents analyzed in this dataset with complete location data in 2019 and 2020.
Bikes
Of those crashes, 6147 involved bicycles with cyclists injured.
Microvehicles
Of those crashes, 134 involved microvehicles with motorists injured.
Maps
Data and Design
These maps include data provided by the City of New York available in the open source crash database and are generated by Plotly Chart Studio and Mapbox geolocation software.
Manhattan Map Reference
For reference, here is a helpful map of the neighborhoods in Manhattan.
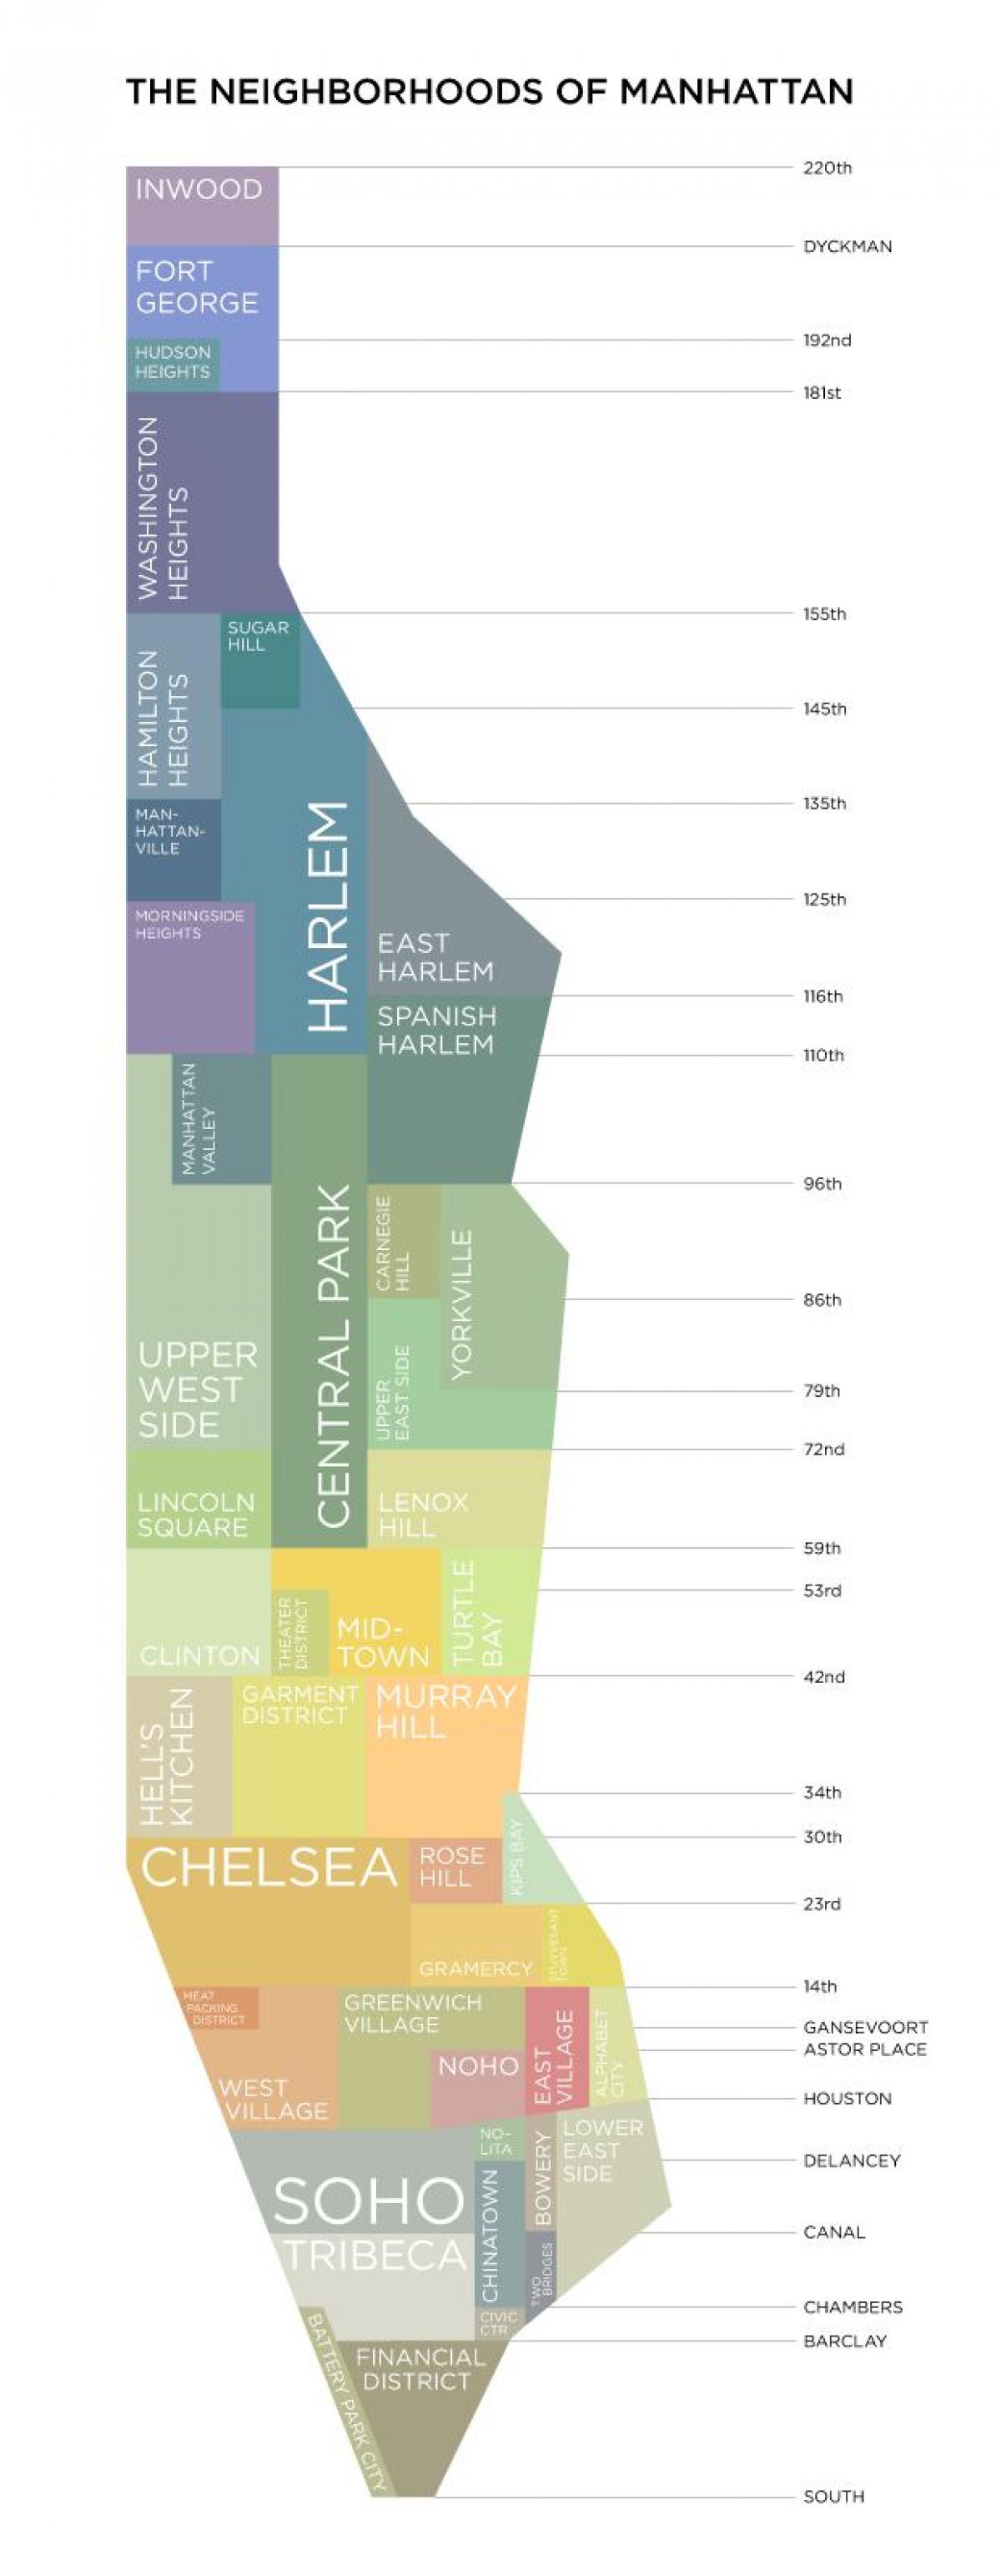
Manhattan Map
Bicycles
With ongoing road improvements and the construction of more bike lanes in New York City in an effort to promote safety, more New Yorkers are traveling by bike.
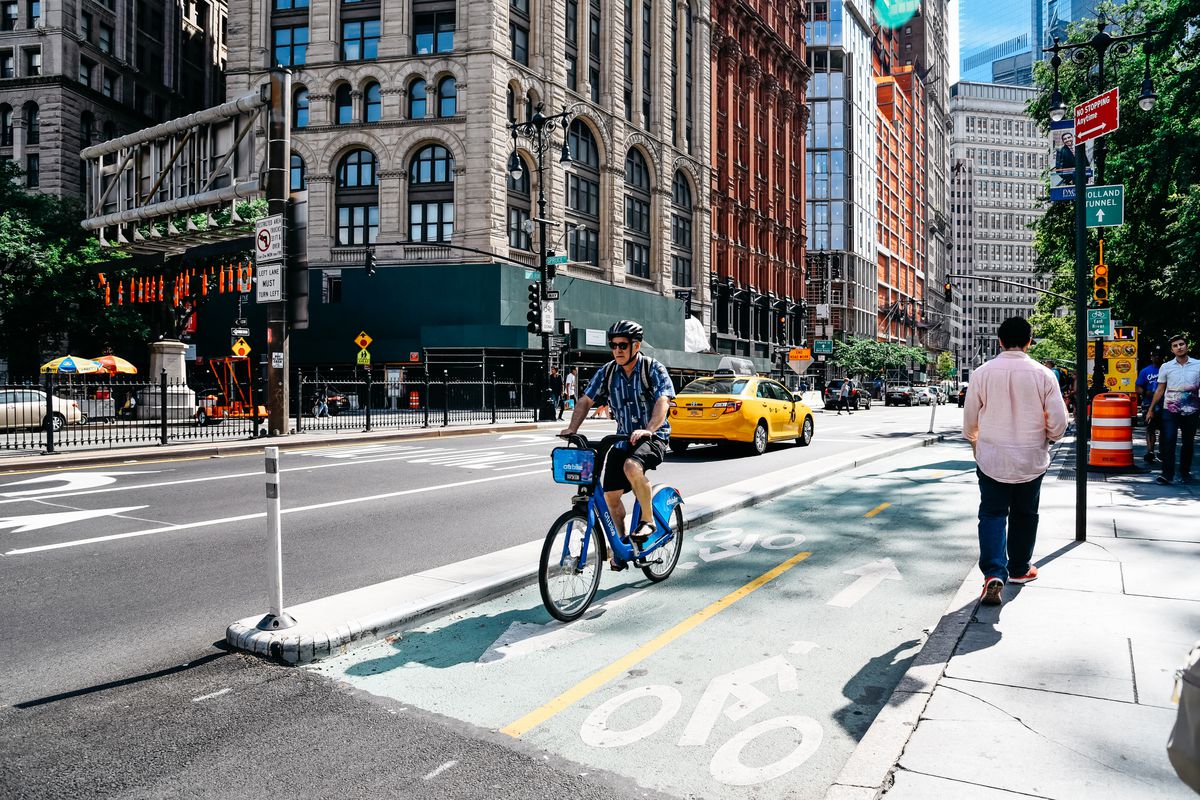
Bike Lane
Cyclist Injuries
This map displays the geolocation of cyclist injuries in New York City from January 2019 to November 2020. The data are interactive and organized by borough and also split by year. Data are not available on the severity of the cyclist’s injuries.
Year to Year Comparison
There appear to some incremental changes in the geolocation of cyclist injuries between 2019 and 2020, including an increase in clustering in the South Bronx in 2020, relative to 2019. Further, data from Queens suggest relatively more cyclist injuries are occurring in the Jackson Heights neighborhood and also appear more scattered in 2020, when compared to 2019.
Neighborhood Clustering
Relative areas of clustering are noted in several Manhattan neighborhoods including East Harlem, as well as the East Village and Lower East Side. In addition, the South Bronx, Williamsburg and Jackson Heights neighborhoods also appear to have a relatively high incidence of cyclist injuries in 2019 and 2020.
Staten Island appears to report relatively few cyclist injuries, when compared to the other four boroughs.
In Manhattan, the Morningside Heights and Upper West Side neighborhoods appear to be areas relatively safer for cyclists. Other neighbhorhoods with relatively fewer cyclist injuries include the Astoria neighborhood in Queens as well as the waterfront areas of the Bronx, Brooklyn and Queens.
Microvehicles (MV)
Microvehicles broadly include two wheeled devices such as battery powered e-bikes, e-scooters, and mopeds. Citing recent trends in increased affordability and more ride sharing services such as Revel, relatively more New Yorkers are traveling by these means.
These vehicles also provide an important alternative to using public transportation. Considering the contagious spread of SARS-COV2 in crowded indoor settings, essential workers in New York considered these means of transport to limit their risk of contracting the virus.
Density Heatmaps
Data and Design
These maps include data provided by the City of New York available in the open source crash database and are generated by Plotly Chart Studio and Mapbox geolocation software and further analyzed with a variable binding density function.
Density - 2019
Density - 2020
Year to Year Comparison
The data in these density plots suggest there are relatively more crashes with cyclists injured in downtown Manhattan in 2019 and 2020. Further, there appears to be a relative increase in the Jackson Heights commmunity in 2020.
Summary
Data in these geolocation and density heatmap plots help identify certain neighborhoods in New York City that appear to be relatively more dangerous to cyclists. They include Manhattan’s East Village and Lower East Side, as well as the Jackson Heights area of Queens. Further, the maps suggest a relative increase in the incidence of microvehicle-related motorist injuries in the South Bronx and the East Harlem neighborhood when comparing 2020 to 2019.